
.gif)
Inserting a Chart
PowerPoint allows you to insert charts into your slide presentation to display different types of information to your audience.
To Insert a Chart:
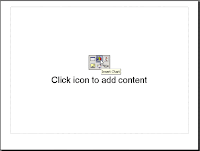
Insert a new slide with a title and a chart icon.
When the slide appears, click the Insert Chart icon
A chart appears with a data sheet and sample data.
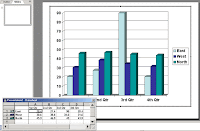.gif)
replace the sample data in the data sheet with actual data that you want to present. The Y axis is for values or numbers. For example, number of hours worked or amount of money earned. The X axis is the label for the information. It now reads East, West, North.
You can delete some information in columns or rows of the sheet. Right click on the row or column and choose Cut, Delete or Clear Contents.
NOTE: You can expand the chart columns to fit your data or titles. Place your mouse pointer over the end of the column in the gray heading. A black cross with double arrows appears. Right click and drag the columns to the size you want.
To format column width, click on FormatColumn width.
Notice that as you enter the new data and titles etc., the chart on the slide changes to show this new information.